
Discovering solutions to improve customer services
PDMS recently worked on a project for a large logistics and service organisation to conduct a process review on their Customer Services team.
The goal was to examine and evaluate the efficiency of their current end-to-end processes and procedures, then develop process maps where required.
Due to the scope of the project and a 6-week timeframe for completion ahead of the busy Christmas period, we had to identify high priority areas where we could add the most value and produce actionable outputs for the organisation to take forward.
To achieve this, it was important for our business analysts to quickly build collaborative relationships with the Customer Service team to enable maximum understanding and knowledge sharing. Our approach was to act as facilitators rather than consultants, working with the team to create value and processes that worked for them. The foundation of our approach was based on collaboration, co-creation and ultimate ownership by the customer services team.
As a result, we developed a strong understanding of the team’s requirements that benefited both the CS team and the organisation’s Executive Team as well in better understanding their processes. Most importantly, we helped identify service improvements which would, in turn, help the team provide a more efficient and effective service to the end customers.

What did we do?
Close collaboration with the CS team was integral to the project’s success, so we set up a collaborative project room on our client’s site. We conducted 30 workshops and interviews with staff, the output of which was a presentation of findings and recommendations for the Executive Team.
Through these interviews, we were able to build an accurate, first-hand picture of the processes - how they were used by the team, the challenges they faced, what worked and what didn’t. This research was invaluable in creating an accurate solution in a way that suited the individual’s requirements and was also actionable by the Executive team.
The overarching methodology we employed followed the Double Diamond design process model and the steps were broken down as follows:
Discovering the problem
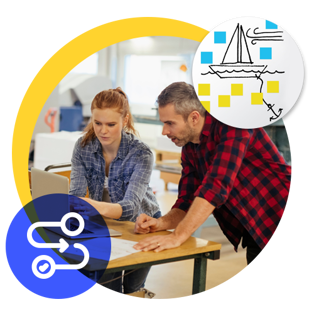
Sailboat exercise
The staff wrote on sticky notes and stuck them to a picture of a sailing boat. Above the horizon was for what worked well in their role (what’s the wind in your sails?) and below the horizon for what worked less well (what’s dragging you down?). The staff then used dots to vote on the sticky notes which resonated most.
We used these notes to build a heatmap of the positive and negatives, which allowed us to identify the most important areas to address.
Staff shadowing
We shadowed members of staff as they completed their tasks to better understand their daily experiences. How did they really undertake the processes in the space, time and technology/equipment they had available?
Service Blueprints
For each of the 29 distinct processes identified, we produced a Service Blueprint. This document consisted of a Customer Journey Map demonstrating how the process was triggered, initialised, explored and resolved – detailing the customer touchpoints, channels and systems used. To gain a holistic view of the whole procedure, we also detailed the process within the wider organisation with the handoffs, channels and systems used between the CS team and other departments. For each stage of the journey, we documented any pain points, hotspots or constraints.
The aim of the Service Blueprint is two-fold. Firstly, to structure, synthesise, communicate and identify opportunities for improvement. Secondly and more importantly, it encourages a collaborative and contextual mindset and tells a full story across the entire process and its touchpoints.
Defining the problem
Ticket sorting
The CS team uses a Case Management System to log the enquiries they handled. Using this system, we conducted a card sorting exercise with the tickets from the last two years to identify the cause of each ticket raised and the proportions of issues attributed to each. Using this exercise and the Service Blueprints, we categorised the processes into five types.
Time Tracker and time spent
As the time records from the CS team’s system weren’t too insightful, we decided to use a subjective technique instead. We asked the CS team to distribute 100 tokens across the five process types to indicate where they spent the proportion of their time.
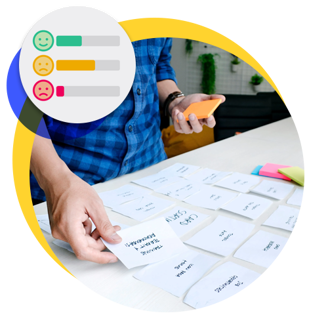
Scoring
Each of the 29 Service Blueprints were annotated with the number of tickets raised and attributed a score on three factors:
- Frequency/quantity
- Time taken
- Difficulty/pain
These factors were then colour-coded on a traffic light scale.
Process pain
We plotted the 29 blueprints on a grid with Difficulty/pain on one axis and Frequency on the other. The plot points were scaled by time spent, which created a clear visual representation of where the effort was concentrated and where improvements would give the greatest value.
Developing the solutions
Service Blueprints
For each pain point or hotspot identified in the Service Blueprint, the CS team proposed solutions or opportunities for improvement.
Co-designing with a cross-functional team
We invited other parts of the business to join the conversations, speaking to internal teams such as projects and IT to identify and discuss feasible solutions.
Strategic factors
Using the organisation’s strategic business plan, we identified relevant strategic factors and cross-referenced them with solutions and opportunities identified to ensure they were aligned with the general strategic direction of the organisation.

Results
Following the workshops, research and analysis, we were ready to share the findings with the Executive Team. It was important to share it in such a way that they could easily act upon it to deliver solutions that met the existing operational challenges.
We presented the findings in a detailed report which covered the following:
- Effort vs Impact plotting - plotting all opportunities onto an Effort vs Impact grid to identify ‘quick wins’ and those which required larger projects to progress.
- Opportunity categorisation – grouping opportunities into eight groups, with each group having a description, recommendations and potential benefits
- High-level system requirements – our findings showed the Case Management System was not fit for purpose, so we performed a high-level gap analysis to identify features to be improved, created, reduced and removed
- Standardised complaints crib sheet – including relevant examples to help the CS team better identify which enquiries should be recorded on the central complaints register
- Service Blueprints – handing over the blueprints to continue as living documents within the CS team
- Backlog and roadmap – assigning the high impact/low or medium effort solutions to owners with expected timescales

To find out more about our blueprint discovery solutions, visit our Discovery webpage